
How to use the Graph Wizard to Plot Graph in Grapher Golden Software
🛍️ Products Mentioned (2)

#GrapherTutorial #GraphWizard #PlottingInGrapher #GrapherTips #DataVisualization #PlottingGuide #GraphingSoftware Learn how to use the Graph Wizard in Golden Software Grapher to create professional graphs fast. This step-by-step tutorial walks you through importing data, choosing the right graph type, and customizing axes, labels, and legends. I demonstrate how to apply styles, set scales, add error bars, and format series for clear visual presentation. You’ll also see tips for exporting high-resolution images and preparing figures for publications or presentations. Whether you’re a beginner or looking to speed up your workflow, this video makes plotting accurate, publication-ready graphs simple. Follow along with sample data, pause where needed, and leave questions in the comments, subscribe for more Grapher and data visualization tutorials! Buy me a coffee here: https://buymeacoffee.com/geojay For business and enquiries: WhatsApp+2347065365193 or Email: geojaygis@gmail.com WhatsApp Group: https://chat.whatsapp.com/CvvLBo7YisgIClQgzL7WOa Facebook Group: https://www.facebook.com/share/g/1Fn4oQzn1L/ Related videos How To Change Map Orientation In Grapher Golden Software: https://www.youtube.com/watch?v=4NV8rxp-7Mk How To Plot Durov Diagram In Grapher Using Water Sample Excel Data Sheet: https://www.youtube.com/watch?v=KHAc36D4F3M grapher tutorial, graph wizard grapher, plot graph grapher, golden software grapher, grapher graphing tutorial, grapher how to, grapher plot guide, grapher data import, grapher export image, grapher chart types, grapher line graph, grapher scatter plot, grapher bar chart, grapher histogram, grapher box plot, grapher error bars, grapher customize axes, grapher labels and legends, grapher formatting, grapher styles, grapher series formatting, grapher scale settings, grapher axis breaks, grapher tick marks, grapher font settings, grapher color palettes, grapher themes, grapher templates, grapher publication figures, grapher high resolution export, grapher PNG export, grapher TIFF export, grapher PDF export, grapher SVG export, grapher presentation figures, grapher scientific plots, grapher engineering plots, grapher statistical plots, grapher time series, grapher XY plot, grapher multi-series plot, grapher secondary axis, grapher trendline, grapher regression line, grapher curve fit, grapher smoothing, grapher interpolation, grapher data labels, grapher annotations, grapher legends placement, grapher axis titles, grapher gridlines, grapher background styles, grapher watermark, grapher plot area, grapher margins, grapher layout manager, grapher page setup, grapher print settings, grapher figure size, grapher resolution settings, grapher units, grapher axis formatting, grapher number format, grapher date axis, grapher log scale, grapher linear scale, grapher scientific notation, grapher error bar styling, grapher marker styles, grapher marker size, grapher line width, grapher dashed lines, grapher color maps, grapher custom colors, grapher import CSV, grapher import Excel, grapher import TXT, grapher copy paste data, grapher data worksheet, grapher data table, grapher data editing, grapher sort data, grapher filter data, grapher group data, grapher pivot data, grapher multiple data sets, grapher stacked plots, grapher overlay plots, grapher subplot arrangement, grapher map overlays, grapher contour plots, grapher surface plots, grapher 3D plots, grapher polar plots, grapher ternary plots, grapher heatmap, grapher density plot, grapher kernel density, grapher spatial plots, grapher GIS integration, grapher batch export, grapher automation, grapher scripting, grapher macro, grapher project file, grapher save project, grapher templates library, grapher tutorial for beginners, grapher advanced tutorial, grapher tips and tricks, grapher best practices, grapher troubleshooting, grapher common issues, grapher error fix, grapher update software, grapher license, grapher student license, grapher academic license, grapher professional license, grapher version compatibility, grapher system requirements, grapher Windows tutorial, grapher Mac tutorial, grapher interface tour, grapher workspace walkthrough, grapher ribbon menu, grapher toolbar tips, grapher property manager, grapher object manager, grapher layer control, grapher publish figures, grapher export for journals, grapher poster setup, grapher presentation export, grapher image optimization, grapher color profiles, grapher CMYK export, grapher RGB export, grapher dpi settings, grapher vector export, grapher raster export, grapher combining plots, grapher aligning objects, grapher snapping objects, grapher guide lines, grapher ruler settings, grapher keyboard shortcuts, grapher step by step guide, how to use graph wizard, graph wizard walkthrough, graph wizard step by step, graph wizard templates, graph wizard presets, graph wizard customization, graph wizard choose graph type
About This Video
Frequently Asked Questions
🎬 More from Geojay GIS Solution
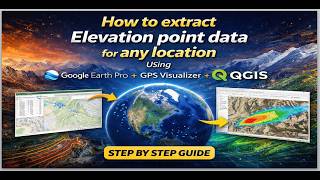
How to extract Elevation point data for any location Using Google Earth Pro + GPS Visualizer + QGIS
26 views

How to download and install ALOHA Software: Areal Locations Of Hazardous Atmospheres on your PC
22 views
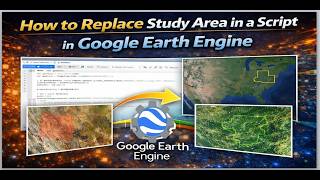
How to Replace Study Area in a Script in Google Earth Engine
25 views
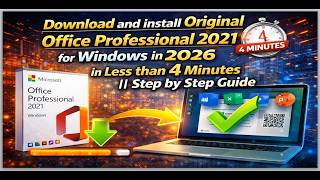
Download and install Original Office Professional 2021 for Windows in 2026 in Less than 4 Minutes
96 views
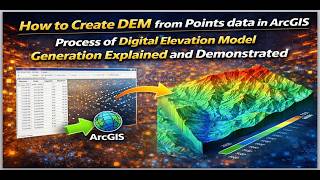
How to Create DEM from Point data in ArcGIS: Process of Digital Elevation Model Generation Explained
29 views

WhatsApp Desktop Login Problem FIXED || WhatsApp QR Code Not Scanning Solution in 2026
51 views