
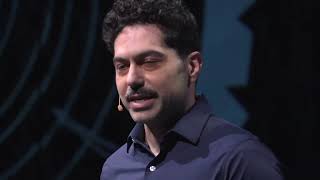
Before You Trust a Chart, Watch This | Sarah Rauchlechner | TEDxDonauinsel
🛍️ Products Mentioned (1)
Every day, charts and graphs shape our opinions, often without us even realizing it. But what if the way data is presented can influence how we vote, think, and make decisions? In this TEDx talk, Sarah Rauchlechner explores the hidden power of information design and reveals how choices such as color, scale, timelines, labels, comparisons, and omitted data points can completely change the story a chart tells. Sarah is a graphic- and information designer based in Vienna always looking for moments of aha – in work projects and in her live. This talk was given at a TEDx event using the TED conference format but independently organized by a local community. Learn more at https://www.ted.com/tedx
🎬 More from TEDx Talks
How to actually change your habits | Kim Foster | TEDxSurrey
12.8K views
How cryptocurrency creates risks for everyone | Tonantzin Carmona | TEDxMidAtlantic
8.6K views
The Right to Be Forgotten: Why the Internet Should Let People Change | Emma Dutta | TEDxKCISLK Youth
561 views
Comparing Ourselves Online: How Social Media Steals Joy | Olivia Chang | TEDxKCISLK Youth
443 views
How stories create systems | Kasem Rodriguez Mohsen | TEDxMtHood
389 views

The Frisbee: What School Lunch Says About Student Health | Joseph Lee | TEDxKCISLK Youth
410 views