
Using the Treemap Visualization
🛍️ Products Mentioned (2)
A Treemap is a powerful #dataanalytics visualization that shows hierarchical data using nested nodes (rectangles) of varying sizes and colors. Known as a “part-to-whole” visualization, much like it’s more well-known cousin the Pie Chart, the Treemap offers two advantages: • Shows relative ranking and differences in data-set values • Makes it simple to drill down for deeper analysis This short video shows how easy it is to create a Treemap using the Reveal embedded #analytics platform. Want to get started using Reveal Today? Try it free for 30 Days: https://app.revealbi.io/ Be sure to check out our latest blog on using the Treemap Visualization: https://www.infragistics.com/community/blogs/b/infragistics/posts/treemap Follow us on Twitter: https://twitter.com/reveal_bi
🎬 More from Infragistics

Accessible React Data Grid: ARIA, Screen Readers & Keyboard Navigation
37 views

React Data Grid CRUD Tutorial with Ignite UI for React and .NET API
120 views

React Data Grid Tutorial: Ignite UI CLI, Claude Code & MCP
147 views

React Data Grid Tutorial with Claude Code, MCP Servers & Ignite UI
87 views
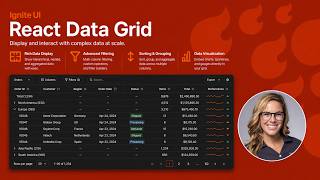
React Data Grid Explained: Features Every Enterprise React App Needs | Ignite UI
62 views

AI Agent Workflows with Ignite UI
141 views