
How to Add Data Visualizations to Your Angular 4 Applications
Data visualization is one of the most important features of any line of business web application. When building Angular applications, you have a wide variety of charts to choose from to get your point across. But how do you pick the best one? And then how do you incorporate that chart into your web applications? Join Infragistics Developer Evangelist, DJ Kumar, as he shows you how to add data visualizations to your Angular application using Ignite UI for JavaScript Angular components.
🎬 More from Infragistics
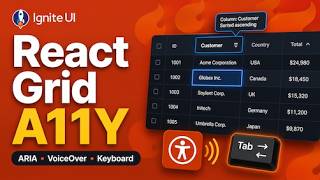
Accessible React Data Grid: ARIA, Screen Readers & Keyboard Navigation
37 views
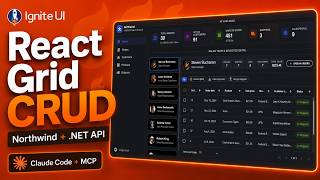
React Data Grid CRUD Tutorial with Ignite UI for React and .NET API
120 views
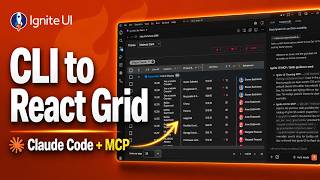
React Data Grid Tutorial: Ignite UI CLI, Claude Code & MCP
147 views

React Data Grid Tutorial with Claude Code, MCP Servers & Ignite UI
87 views
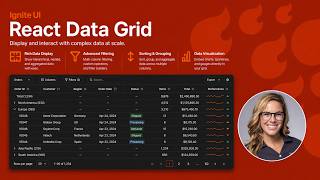
React Data Grid Explained: Features Every Enterprise React App Needs | Ignite UI
62 views
AI Agent Workflows with Ignite UI
141 views