
Trend Reversal Indicator WIth Back testing results
🛍️ Products Mentioned (4)
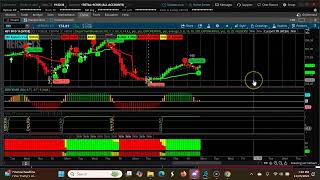
https://usethinkscript.com/threads/trend-reversal-for-thinkorswim.183/ reversal indicator. It uses moving averages, ZigZag patterns, and Fibonacci to generate reversal signals on your chart. One thing to note is that this indicator will be repainted. The Buy and Sell signal will disappear if the candlestick closes above or below the stop loss line. If that happens, you can use that as a trigger point to cut losses early. Chart http://tos.mx/LgQ0zE3 Bearish Scan http://tos.mx/Yk2Btpu Bullish http://tos.mx/lqWf321 Green = Buy Signal Bars Purple = Neutral Red = Sell Signal Bars
🎬 More from pivotables

Fisher Transform: The Ultimate Oscillator for Bullish & Bearish Trades!
303 views
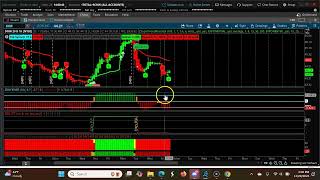
Top 3 Bearish Stocks for Dec 2nd 6th 2024 Decending CPR Technical SCAN Analysis
199 views
Top 3 Bullish Stocks for Dec 2nd 6th 2024 Ascending CPR Technical SCAN Analysis
57 views
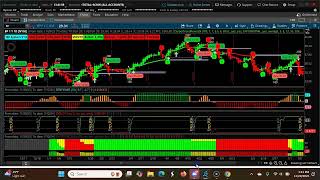
Top 3 Bearish Stocks December 2024 CPR Technical Analysis Breakdown
63 views
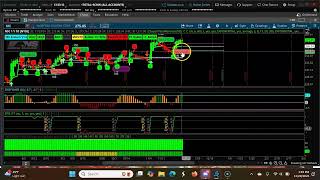
Top 3 Bullish Stocks for December 2024 Ascending CPR Technical SCAN Analysis
25 views
Mastering Short-term Swing Trading With Three Down Trending CPR Trends Nov 25th - Nov 29th, 2024
102 views