
How to Use Regression on Ti84CE Graphing Calculator
Master the regression feature on your TI-84 CE calculator with this comprehensive, step-by-step tutorial! Whether you need to find a line of best fit, an exponential curve, or another regression model, this video will show you exactly how to input data, perform the calculations, and interpret your results. In this tutorial, you will discover: Accessing the STAT Menu: How to enter and clear data in List 1 (X-coordinates) and List 2 (Y-coordinates). Inputting Data Points: Entering your x and y values into the calculator lists. Choosing Regression Types: Exploring various options like linear, quadratic, cubic, quartic, exponential, logarithmic, power, logistic, and sinusoidal regression. Performing Regression: Selecting your desired regression type (e.g., exponential regression) from the "CALC" menu. Storing the Regression Equation: How to save the calculated equation directly into Y= for graphing. Interpreting Results: Understanding the regression equation (e.g., y = a*b^x) and the correlation coefficient (R-value). Troubleshooting "DiagnosticOn": Essential steps to enable the display of the R-value if it's not showing up. Graphing the Regression: How to view your data points and the regression curve on the graph. Troubleshooting Stat Plot: Ensuring your Stat Plot is "On" to see your data points. This video is perfect for algebra, pre-calculus, and statistics students using a TI-84 CE calculator for data analysis and modeling. Timestamps: 0:00 - Introduction to Regression on TI-84 CE 0:30 - Accessing STAT Edit and Clearing Lists 1:20 - Inputting X and Y Data Points 2:00 - Navigating to STAT CALC and Choosing Regression Type 2:50 - Storing the Regression Equation into Y= 3:40 - Calculating and Interpreting Regression Results (Equation & R-value) 4:10 - Troubleshooting: Turning "DiagnosticOn" to See R-value 5:50 - Reviewing the Regression Process with "DiagnosticOn" 6:30 - Viewing the Equation in Y= and Graphing 7:00 - Adjusting Zoom (ZoomStat or ZoomStandard) 7:30 - Troubleshooting: Ensuring Stat Plot is "On" to See Data Points 8:30 - Conclusion & More TI-84 Videos Don't forget to like, comment, and subscribe for more TI-84 calculator tutorials and math help! #TI84CE #Regression #LinearRegression #ExponentialRegression #QuadraticRegression #Statistics #Algebra #PreCalculus #CalculatorTutorial #MathHelp ➡️JOIN the channel as a CHANNEL MEMBER at the "ADDITIONAL VIDEOS" level to get access to my math video courses(Algebra 1, Algebra 2/College Algebra, Geometry, and PreCalculus), midterm & final exam reviews, ACT and SAT prep videos and more! (Over 390+ videos) https://www.youtube.com/channel/UClOR1BiPyOkkIAnv9Cmj4iw/join
🎬 More from Mario's Math Tutoring

Find the Volume of a Sphere Given Inscribed Cube with Side Length
60 views
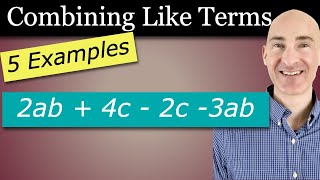
Combining Like Terms Finally Clicks After Watching This
318 views
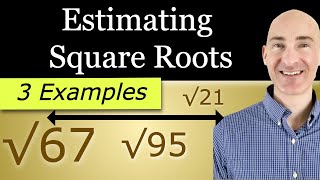
Square Root Approximation Explained (Easy Method!)
477 views
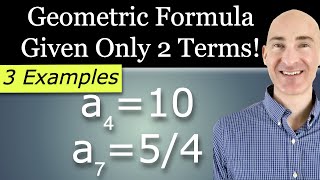
How to Find a Geometric Formula Using Two Terms | Easy Method
738 views
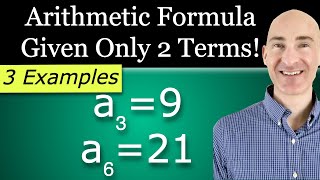
How to Write an Arithmetic Sequence Formula From 2 Terms | Step-by-Step
885 views
How to Calculate Percentages (2 Easy Methods!)
3.4K views