
Pearson Correlation in SPSS 27- How to Calculate and Interpret (Part 2)
🛍️ Products Mentioned (3)
In this video, we'll walk you through how to compute a Pearson product-moment correlation in SPSS, step-by-step. We'll explain what a Pearson correlation coefficient is, when to use it, and how to interpret the results. Here is the link to the dat...
SPSS Survival Manual Book:
Research Methods and Statistics for Public and Nonprofit Administrators:
In this video, we'll walk you through how to compute a Pearson product-moment correlation in SPSS, step-by-step. We'll explain what a Pearson correlation coefficient is, when to use it, and how to interpret the results. Here is the link to the data file and PowerPoint presentation (https://bit.ly/3L8FUS5). If you're new to SPSS or need a refresher, we recommend using the "SPSS Survival Manual" by Julie Pallant. This book is a great resource for learning how to perform statistical analyses in SPSS, including correlation analysis. Link 1: SPSS Survival Manual Book: https://www.routledge.com/SPSS-Survival-Manual-A-step-by-step-guide-to-data-analysis-using-IBM-SPSS/Pallant/p/book/9781760875534 Link 2:Research Methods and Statistics for Public and Nonprofit Administrators: https://us.sagepub.com/en-us/nam/research-methods-and-statistics-for-public-and-nonprofit-administrators/book237346 By the end of this video, you'll have a solid understanding of how to use SPSS to compute Pearson correlations, and how to interpret the results to answer research questions. Don't forget to like and subscribe for more statistics tutorials and tips!
🎬 More from Doctor Square

No Login Required | Download TikTok Posts Data to Excel in 2026 | Export TikTok to CSV for Research
167 views
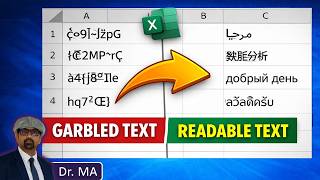
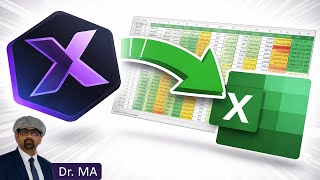
Fix Non-English Text in Excel - Fix Unreadable Multilingual Text in Excel
370 views
Download Twitter Data to Excel (No Coding) - 2026 | Export X Tweets to CSV
2.2K views

SciSpace New Features in 2026 - My Library, Zotero, Save to Notebook and Generate Report
79 views
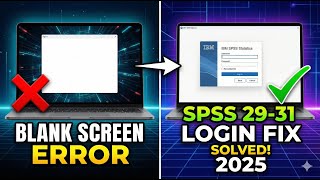
SOLVED: How to Fix SPSS Login Blank Screen Issue | SPSS 31, 30 & 29 Trial Activation Fix
3.7K views

Can We Really Detect AI Writing in Research Papers? Testing SciSpace AI Detector
55 views