
How to Perform and Interpret a Chi-Square Test in SPSS (with APA Table)
🛍️ Products Mentioned (1)
In this video, you will learn how to conduct a chi-square test of independence using SPSS 29 version. To access the data + PowerPoint presentation used in the video, please click on this link: https://bit.ly/48BhOZx A chi-square test of independence is a statistical method to determine whether two categorical (nominal/ordinal) variables are related or independent. For example, you may want to test whether gender and political affiliation are independent of each other. To perform this test, you need to have a contingency table that shows the frequency distribution of the two variables across different categories. You will see how to set up a contingency table in SPSS, and how to calculate the expected frequencies based on the marginal totals. You will also learn how to perform the test using the SPSS menu, and how to interpret the output. The output will show you the chi-square statistic, the degrees of freedom, and the p-value. You will learn how to compare the p-value with your chosen significance level, and how to draw a conclusion about the null hypothesis. You will also learn how to report the findings in APA style. I hope you find this video helpful and informative.
🎬 More from Doctor Square

No Login Required | Download TikTok Posts Data to Excel in 2026 | Export TikTok to CSV for Research
167 views
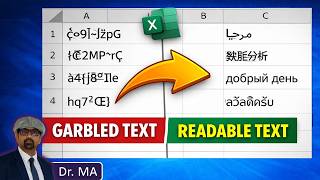
Fix Non-English Text in Excel - Fix Unreadable Multilingual Text in Excel
370 views

Download Twitter Data to Excel (No Coding) - 2026 | Export X Tweets to CSV
2.2K views

SciSpace New Features in 2026 - My Library, Zotero, Save to Notebook and Generate Report
79 views
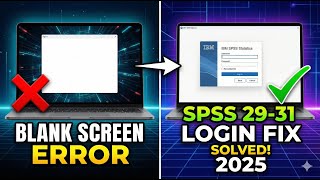
SOLVED: How to Fix SPSS Login Blank Screen Issue | SPSS 31, 30 & 29 Trial Activation Fix
3.7K views

Can We Really Detect AI Writing in Research Papers? Testing SciSpace AI Detector
55 views