
Is this your channel?
Create a SLICK Dashboard for your homelab using Grafana, Telegraf and InfluxDB.
17.5K views· 417 likes· 10:39· Dec 1, 2020
In this video, I go over how to Create the TIG monitoring stack - Telegraf, InfluxDB and Grafana. 0:00 Introductiona nd InfluxDB installation 1:45 InfluxDB - Connecting, creating database and users. 3:30 Grafana Installation and Setup 5:20 Connecting to Grafana GUI and Creating Data Sources 7:04 Importing a pre-built Dashboard 8:12 Telegraf installation and configuration 9:30 Viewing our dashboard
🎬 More from DevOps Journey
Portainer: The Ultimate Kubernetes Management Tool
3.7K views

Modern Infrastructure CI/CD with Spacelift
3.7K views
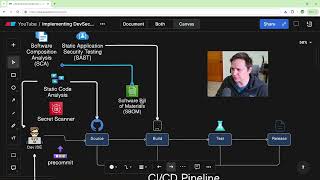
How to Create a DevSecOps CI/CD Pipeline
64.0K views

Solving Microservice Complexity with OpenTelemetry and Lumigo
3.3K views

The Anti-Malware browser that Self Destructs
1.6K views

Argo Rollouts in 15 minutes!
21.6K views