
Python ML #09: Profitability Analysis Tutorial - Calculating Metrics #machinelearningbasics
🛍️ Products Mentioned (1)
Hey! I'm Amir and I love Finance and Economics. In this Python tutorial, you'll learn how to build a powerful profitability analysis application. We'll cover the calculation of key financial metrics, including Net Present Value (NPV), Internal Rate of Return (IRR), Payback Period, and Profitability Index (PI). Then, we'll explore how to visualize the financial data using Plotly, a versatile data visualization library. By the end of this tutorial, you'll have a Python application that can calculate financial metrics and display interactive line charts for better data analysis and decision-making. Hope you will enjoy this one. GitHub: https://github.com/BekBrace/Financial_Metrics_Machine_Learning Instagram: https://www.instagram.com/bek_brace/ Join this channel to get access to perks: https://www.youtube.com/channel/UC7EVSn5inapL20oPSwAwEUg/join
🎬 More from BekBrace

My message for today ! #positivevibes #positivity #code
119 views
C# Programming Crash Course (dotnet-script)
731 views

Code your first Pascal Program | #pascal #programming
456 views
Pascal Programming
996 views
Monads in Haskell | with Functors & Applicatives | #haskell #programming
1.5K views
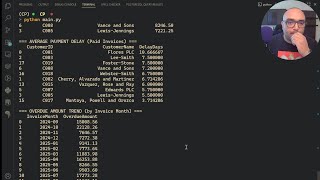
Real life AR Business Tool - Customer Payment Analysis Program in Python #python #pythonprogramming
460 views